Data Usage
Value creation through analysis and intelligent algorithms On their road to becoming data driven, organisations need not only to gather data, but also to effectively analyse the data. This practice ranges from visualization to using intelligent algorithms, or even embedding it into a solution-based product. Data Usage can be split up into Dashboarding, Analytics, Data Science, and Data Products.
Eager to know more?
Then definitely get in touch with Tobian Wouter. He will be happy to schedule a first (virtual) meeting to discuss all your possibilities.
Let's get started!
Eager to know more?
Then definitely get in touch with Tobian Wouter. He will be happy to schedule a first (virtual) meeting to discuss all your possibilities.
Let's get started!
Dashboarding
A lot of companies today are turning to self-service Business Intelligence, as an increasing number of employees need access to the data to make wiser decisions. Tools like Tableau or PowerBI allow users to create their own dashboards. These dashboards typically contain clean and clear visualizations and can be refreshed easily as new data becomes available.
Analytics
Next to dashboards, companies often have different analysts across business departments tackling basic to complex data questions, such as “What was the impact of the pandemic for
our organisation?”. These analysts typically both have a good business sense, and knowledge of analytical tooling and methodology to answer questions correctly.
“Business value of data is created through data usage. Whether through intelligent algorithms or widely available dashboards, data supports better decisions in data-driven companies.”
Geert Verstraeten
Data Science
Data science takes the next step as it delivers the intelligence in AI. Companies deploy algorithms to turn knowledge from the past into accurate predictions about the future. For example, using sales patterns of historical purchases, organisations build algorithms to predict which clients will buy a certain product next. Modern data science also involves anomaly detection (e.g. fraud detection), recommendation engines (e.g. cross-selling the right product or service to the right client), and natural language processing (e.g. routing emails to the right agents).
Data Products
Usage of data is not a one-off analytical exercise. When Netflix creates a recommendation engine to recommend series to their viewers, it should be put into production. An MLOps framework takes an experimental machine learning model and makes sure it robustly produces relevant output. In that sense, the analysis becomes a data product. Sometimes it is further integrated into a full-blown digital product, such as an API, a mobile app, or a website. In some occasions, the data product suffices (consider a bank where bankers receive the outcome of the credit evaluation), in other cases, the digital product enforces the solution (consider a bank where clients can compute the outcome of their credit evaluation through their banking app).
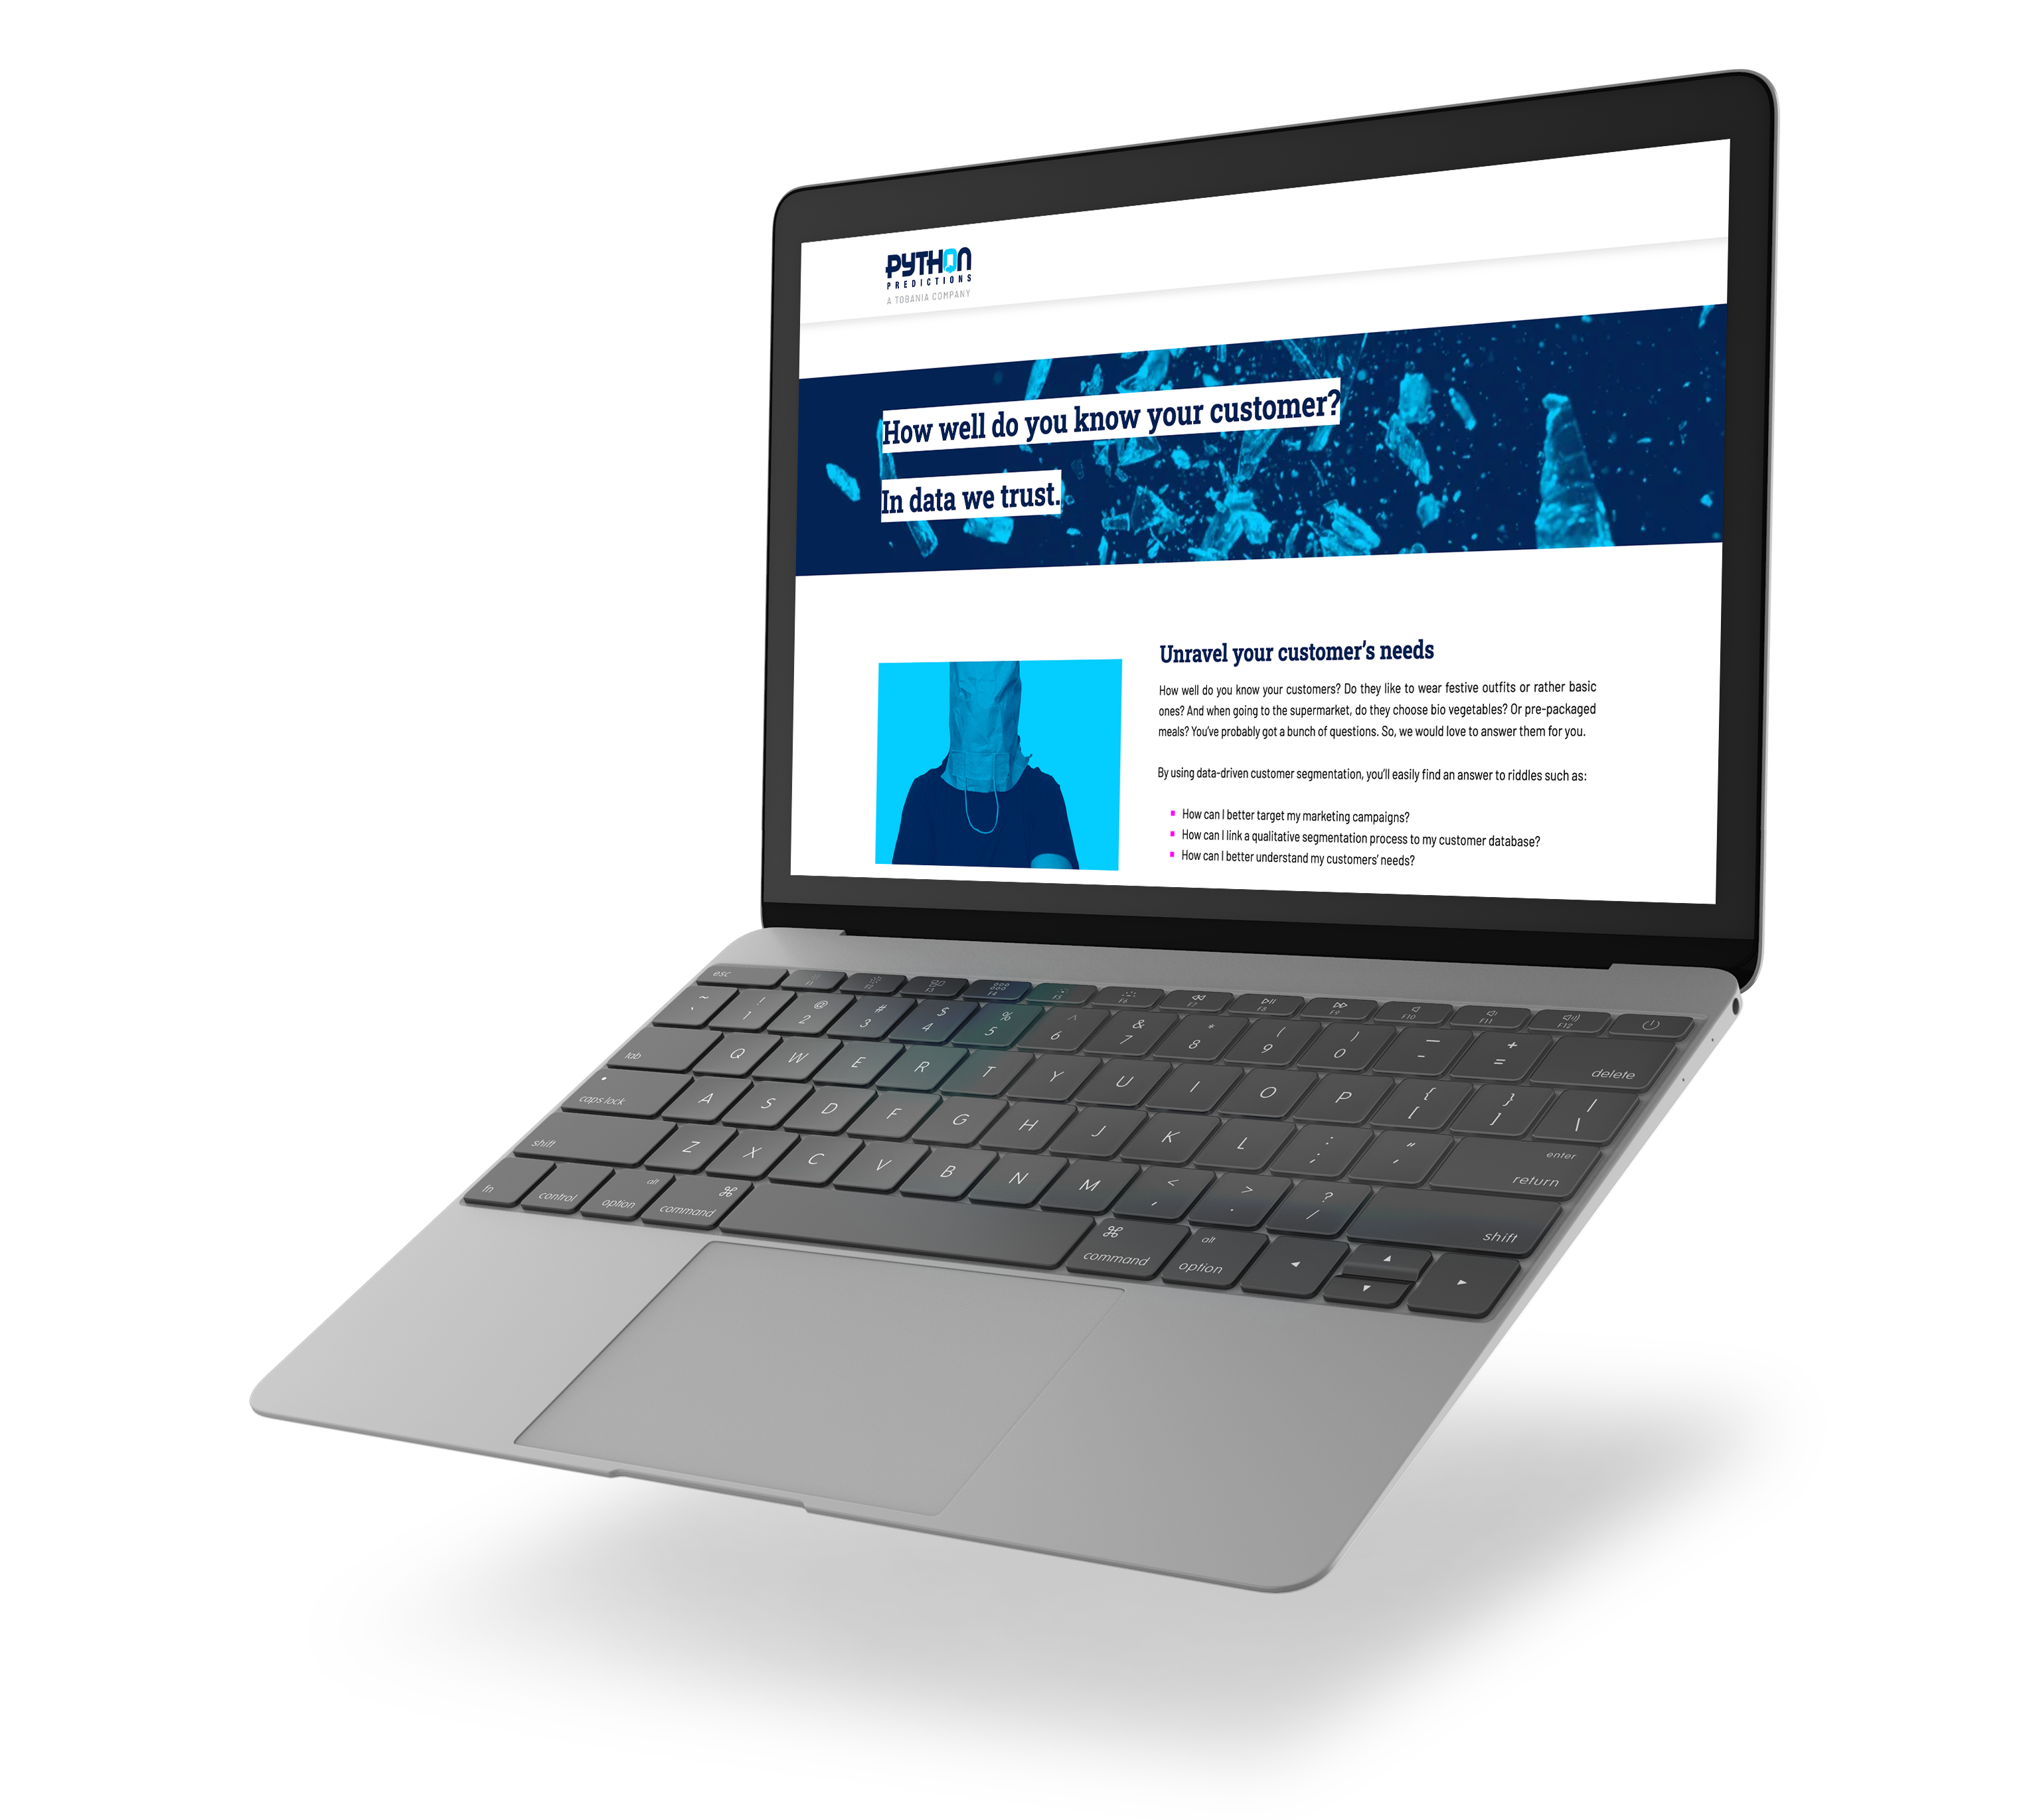
How well do you know your customer?
In data we trust!
By using data-driven customer segmentation,
you’ll easily find an answer to riddles such as:
How can I better target my marketing campaigns?
How can I link a qualitative segmentation process to my customer database?
How can I better understand my customers’ needs?
Let's set a date!
Related insights
I just can't get enough
Discover our news and blogs!







.png)